
Graphs & Gradients explained - get those easy marks in the test

Cheese. Source of Joy.
Graphs make up a huuuge part of the gcse maths syllabus.
Its a topic that comes up in both foundation and higher tier, the questions can easily range from level 3 to level 9.
This is a good thing because it means that by studying 1 main topic, you can improve your grade by a LOT.
Also, graphs are linked to algebra - think about it, every equation can be plotted on a graph…so that’s another reason why this topic is worth putting the time and effort into.
Let’s get stuck in. I’m going to start right from the basics of graphs.
What is a graph?

A graph represents the link between 2 different things.
For example: You could draw a graph to show the link between ice cream sales and month of the year.
The graph would go up in the summer months and down during the cold months.
Let’s start with some data and the easy kind of graph - or bar chart- we used to draw in primary school:
Month Ice Creams sold (based on uk “summer” times)
January 0 July 150
February 25 Aug 250
March 30 Sep 60
April 45 Oct 30
May 100 Nov 0
June 120 Dec 0
We can draw the same bar chart by plotting the points instead
Graphs can be curved or straight.
That grid that the graph is drawn on is called a set of axes.
In this case we have number of ice creams on the side that goes up.
We’ve put the months of the year along the bottom going across the page.
In gcse maths there are two graphs topics.
One is about the kind of graphs and charts like the ice cream data.
The other graphs are to do with x and y and plotting equations on to a graph.
In this blog post I’m going to talk about the x and y type graphs. We will come back to more data type stuff in another blog post.
Drawing Axes:
Some of my students really struggle with drawing the starting grid.
Always use a ruler!
Always draw your grid from -10 to +10 on both the x and the y axes - unless its very obvious from the question that the graph will be bigger.
Start by drawing a large + sign.
If you draw a horizontal line that is 20cm wide and then in the middle of that draw another 20cm line that is vertical, you should get a nice set of axes.
If you mark off every cm you can then use any scale you want.
Here’s an example from desmos.com - but you need to practice drawing this yourself too.
Remember: the line that goes left/right across the page is horizontal and is called the x axis
The line that goes up/down the page is vertical and is called the y axis
As I said earlier a graph represents the link between two things.
In the graphs we are doing it will be the link between x and y.
Let’s start with coordinates:
Coordinates are used to describe any point on the axes or grid that we’ve just drawn.
Think of it like a building full of small rooms or lockers.
If you want to find a particular room I might describe it to you like this: Go into the building, go to the third room and then go up one and that’s the room you are looking for.
I can say that shorter: Go in, across to the the third room then go up one.
Or I could write it like this: 3 across, 1 up.
And if we have a system where everyone knows that the first number is across and the second number is up, we have coordinates: (3, 1).
Of course on the axes across means left or right and up is up or down.
Below, I have marked some coordinates:
Have a look and see if you can figure out the coordinates

A set of coordinates marked on a set of axes
Where would these go? (5 , 1) (-1,-1) (2, 6) (-4,-3)
If you use desmos you can type them in the left hand side and see if you are correct.
Hopefully now, you have a good understanding of coordinates.
Let’s have a look at the most basic straight line graphs.
If we have this set of coordinates: (1, -3) (1, -2) (1, -1) (1, 0) (1, 1) (1, 2) (1, 3)
It looks like this on a graph:

The graph of x = 1
It’s one vertical line. This is because the x coordinate is always 1. Only the y value changes. So we call this graph x =1
Here are some more, can you match up the names to the graphs?

Now, what if we swapped it?
What if we changed the coordinates so that the y value in every coordinate is always 1?
This would be the line of y = 1.
And this is what it looks like:

The graph of y = 1
The line y = 1 goes across the page.
It might seem like it should be the other way round.
With y = 1, the x values change, this is why the line goes across the page. The y value is fixed at 1 and that’s why its a horizontal line at 1.
With x = 1, the y values change, this is why the line goes up/down the page. The x value is fixed at 1.
Here are a few more y graphs.

I hope this is making sense so far. I would highly encourage you to head over to desmos.com - its free - and play around with graphs using their tool. It will help you see what’s happening.
We learn best by doing and breaking stuff.
Straight Line Graphs
We are going to step it up now, this section is going to be slightly harder.
Have a look at these coordinates: (-2, -2) (-1, -1) (0, 0) (1 , 1) (2, 2) (3, 3) (4, 4)
What do you notice? Yep, x and y are the same in each coordinate.
So this graph would be called y = x. ( x = y is still correct, but we always start with y = )
Here’s what it looks like if you were to mark all of those points and join them up

Graph of y = x
How would you draw/plot this graph without desmos?
You always start with a table of values.
Choose some values for x.
Then calculate what the y values would be using the equation of the graph.
For y = x:
I chose to do values of x from -5 to +5
Then because the equation is y = x, you just fill in the second row accordingly.
Then plot the coordinates and you will get the graph in the picture above.
| x | -5 | -4 | -3 | -2 | -1 | 0 | 1 | 2 | 3 | 4 | 5 |
|---|---|---|---|---|---|---|---|---|---|---|---|
| y = x | -5 | -4 | -3 | -2 | -1 | 0 | 1 | 2 | 3 | 4 | 5 |
Let’s do another graph.
Let’s plot the graph of y = 2x
The table would look like this:
| x | -5 | -4 | -3 | -2 | -1 | 0 | 1 | 2 | 3 | 4 | 5 |
|---|---|---|---|---|---|---|---|---|---|---|---|
| y = 2x | -10 | -8 | -6 | -4 | -2 | 0 | 2 | 4 | 6 | 8 | 10 |
The coordinates look like this: (-5, -10) (-4, -8) (-3, -6 ) and so on.
And then the graph looks like this:
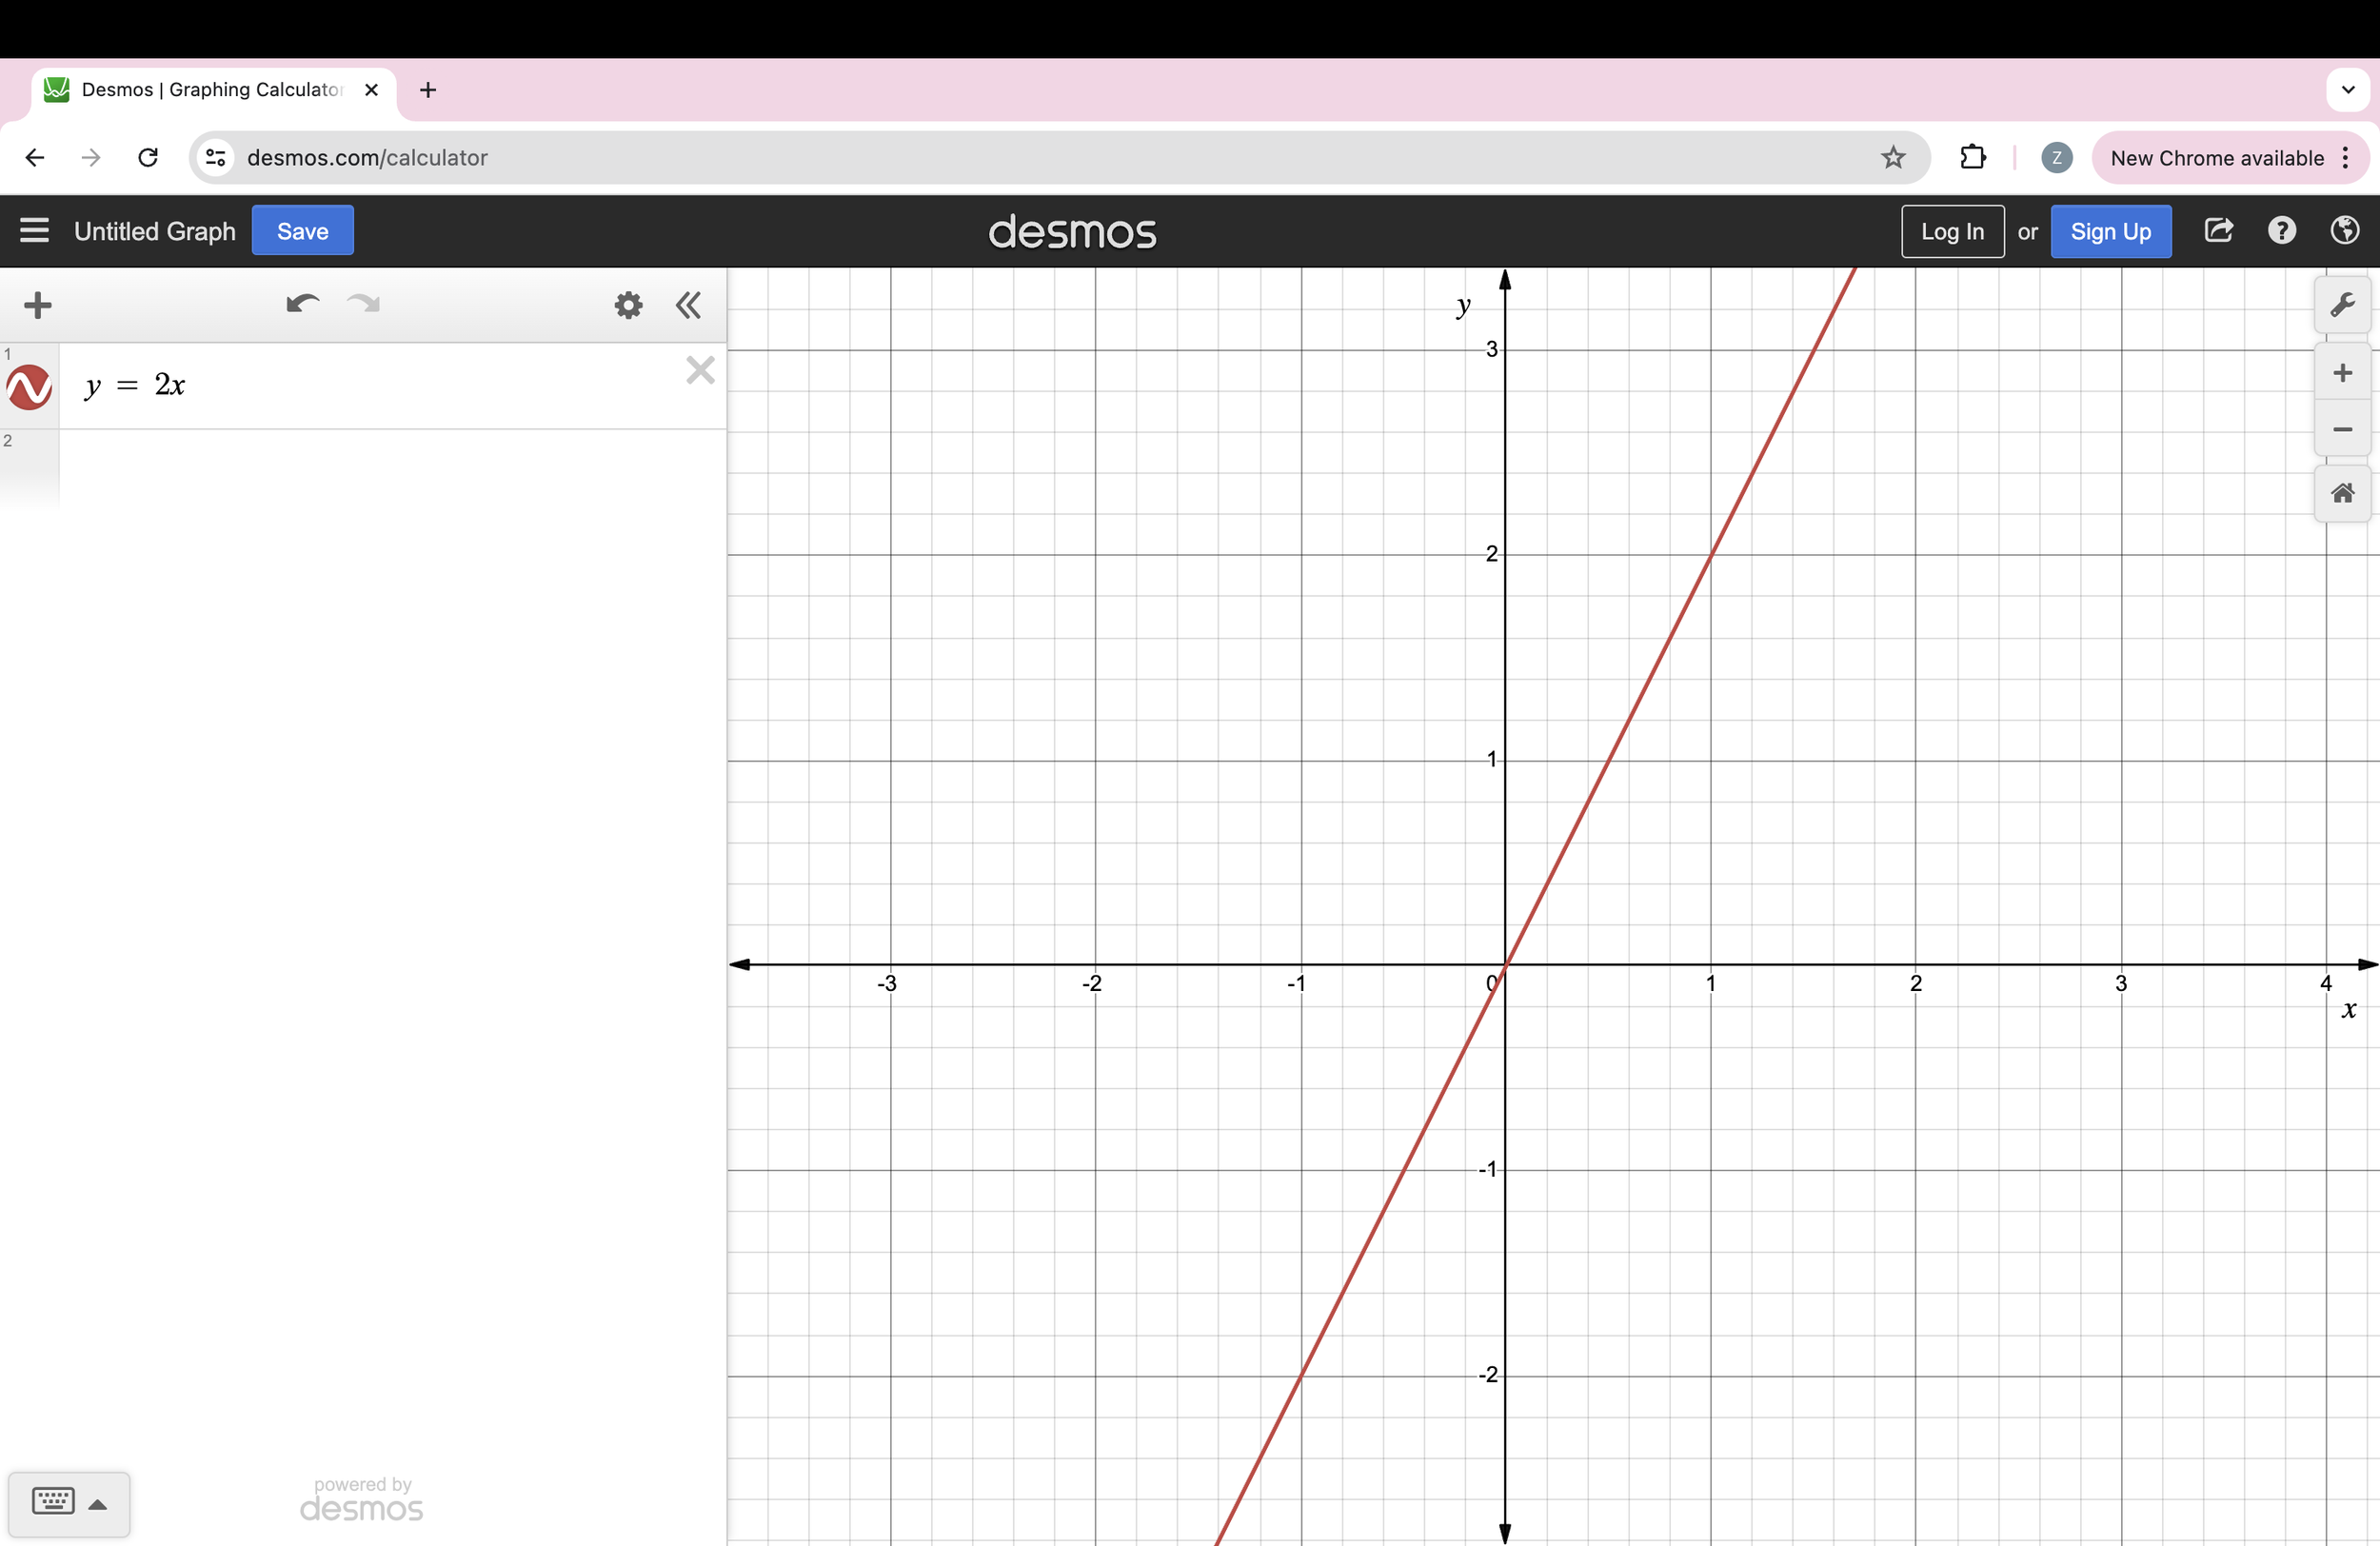
Graph of y = 2x. Notice this is steeper than the line y = x.
We could draw the graph of y = 2x + 3
Here’s the table:
| x | -5 | -4 | -3 | -2 | -1 | 0 | 1 | 2 | 3 | 4 | 5 |
|---|---|---|---|---|---|---|---|---|---|---|---|
| y = 2x | -10 | -8 | -6 | -4 | -2 | 0 | 2 | 4 | 6 | 8 | 10 |
| y = 2x + 3 | -7 | -5 | -3 | -1 | 1 | 3 | 5 | 7 | 9 | 11 | 13 |
The coordinates are the first row and the last row: (-5, -7) (-4, -5) (-3, -3) (-2, -1) and so on.
Here’s what it looks like:
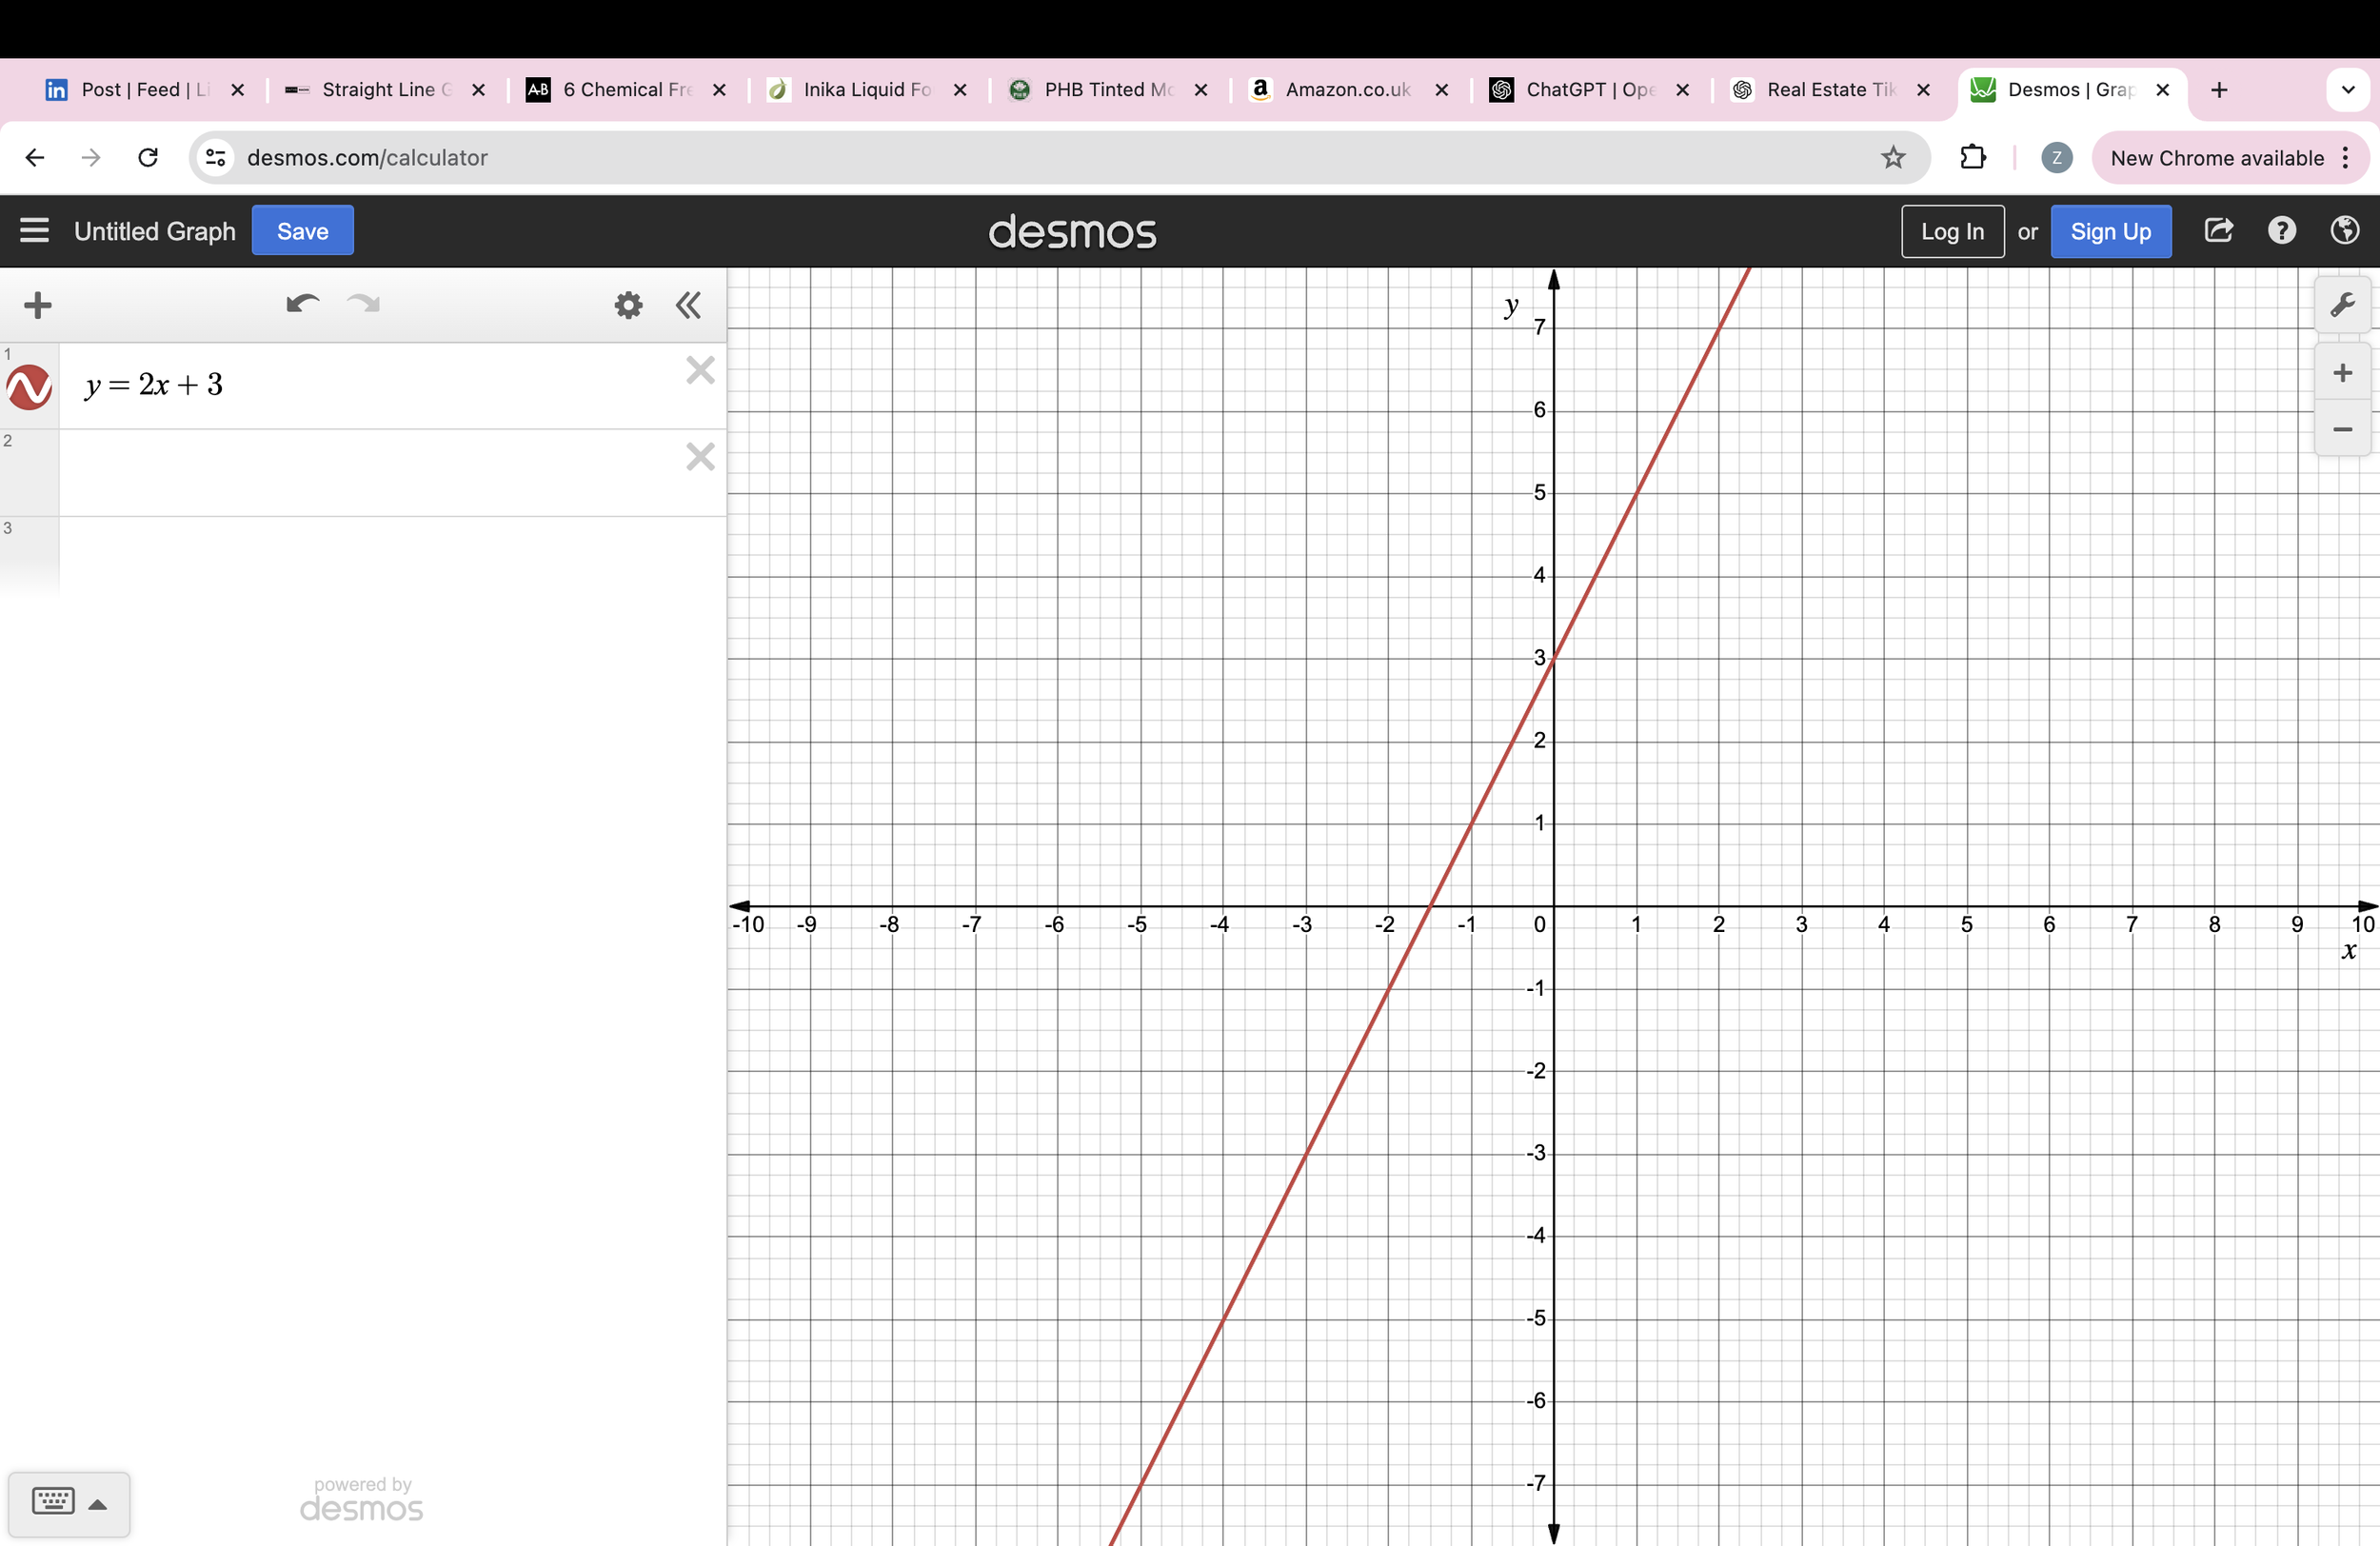
Graph of y = 2x +3. Notice it does not go through (0, 0).
Equation of a Straight Line
If you carry on playing around with different straight line graphs, you will notice that they are all written in the same format:
y = mx + c
This is super important, so make a note, stick it on your bathroom mirror and memorise this.
The m is the gradient of the graph - how steep the line is.
The c is where it crosses the y axis - the y intercept.
Working out the gradient
The gradient of a slope is a measure of how steep that slope is.
For example, if you are walking up a hill and its height changes from 0m to 5m across a width of 1m, that’s a very steep hill. We divide the height by the width, so in this case, 5/1, which is 5. So the gradient of this particular hill is 5.
If we were walking up a different hill, and this time, the height goes up to 1m, across a distance of 5m, that’s a much nicer hill to walk up. Its much less steep. Dividing the height by width, gives us: 1/5, so the gradient is 1 fifth.
In other words the gradient tells us how quickly a slope rises up. The higher the number the steeper the line.
Working out the gradient on a graph
On a graph, to work out the width and height, you need two points on the line and subtract the x and y values from each other.
Below is a line, we can pick 2 points on that line to work out the gradient: (-2 , -1) and (0 , 5)
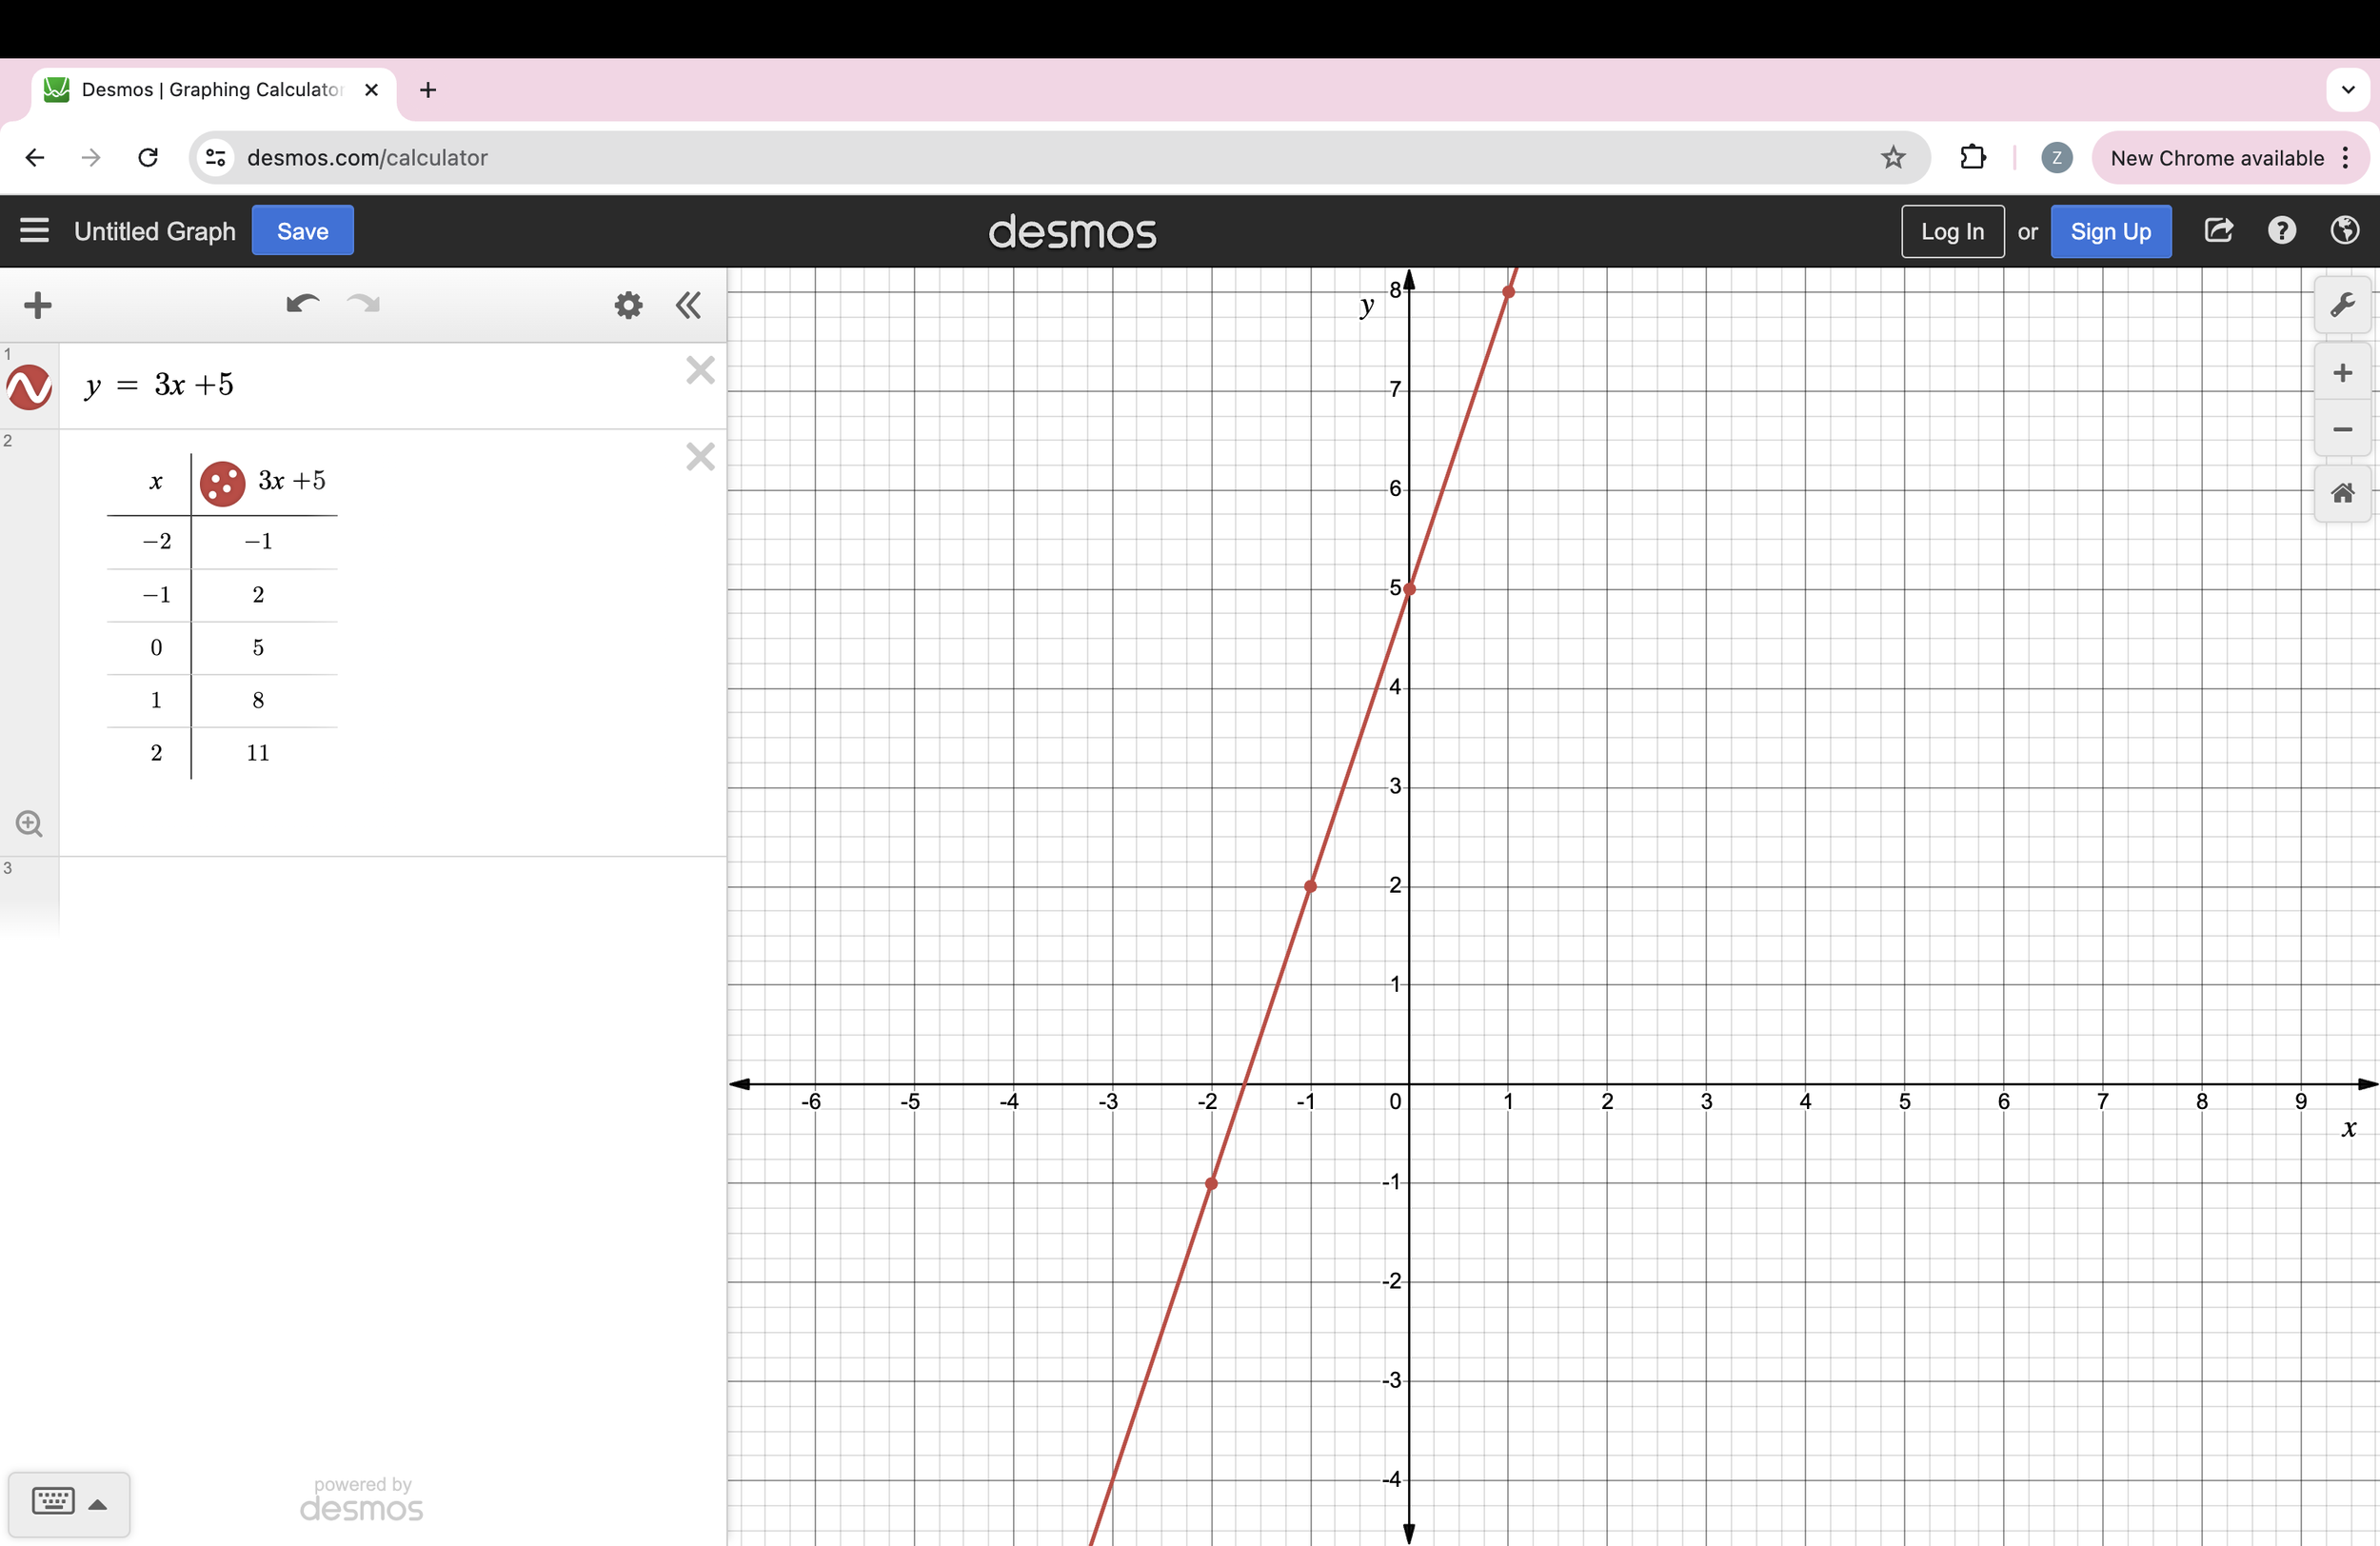
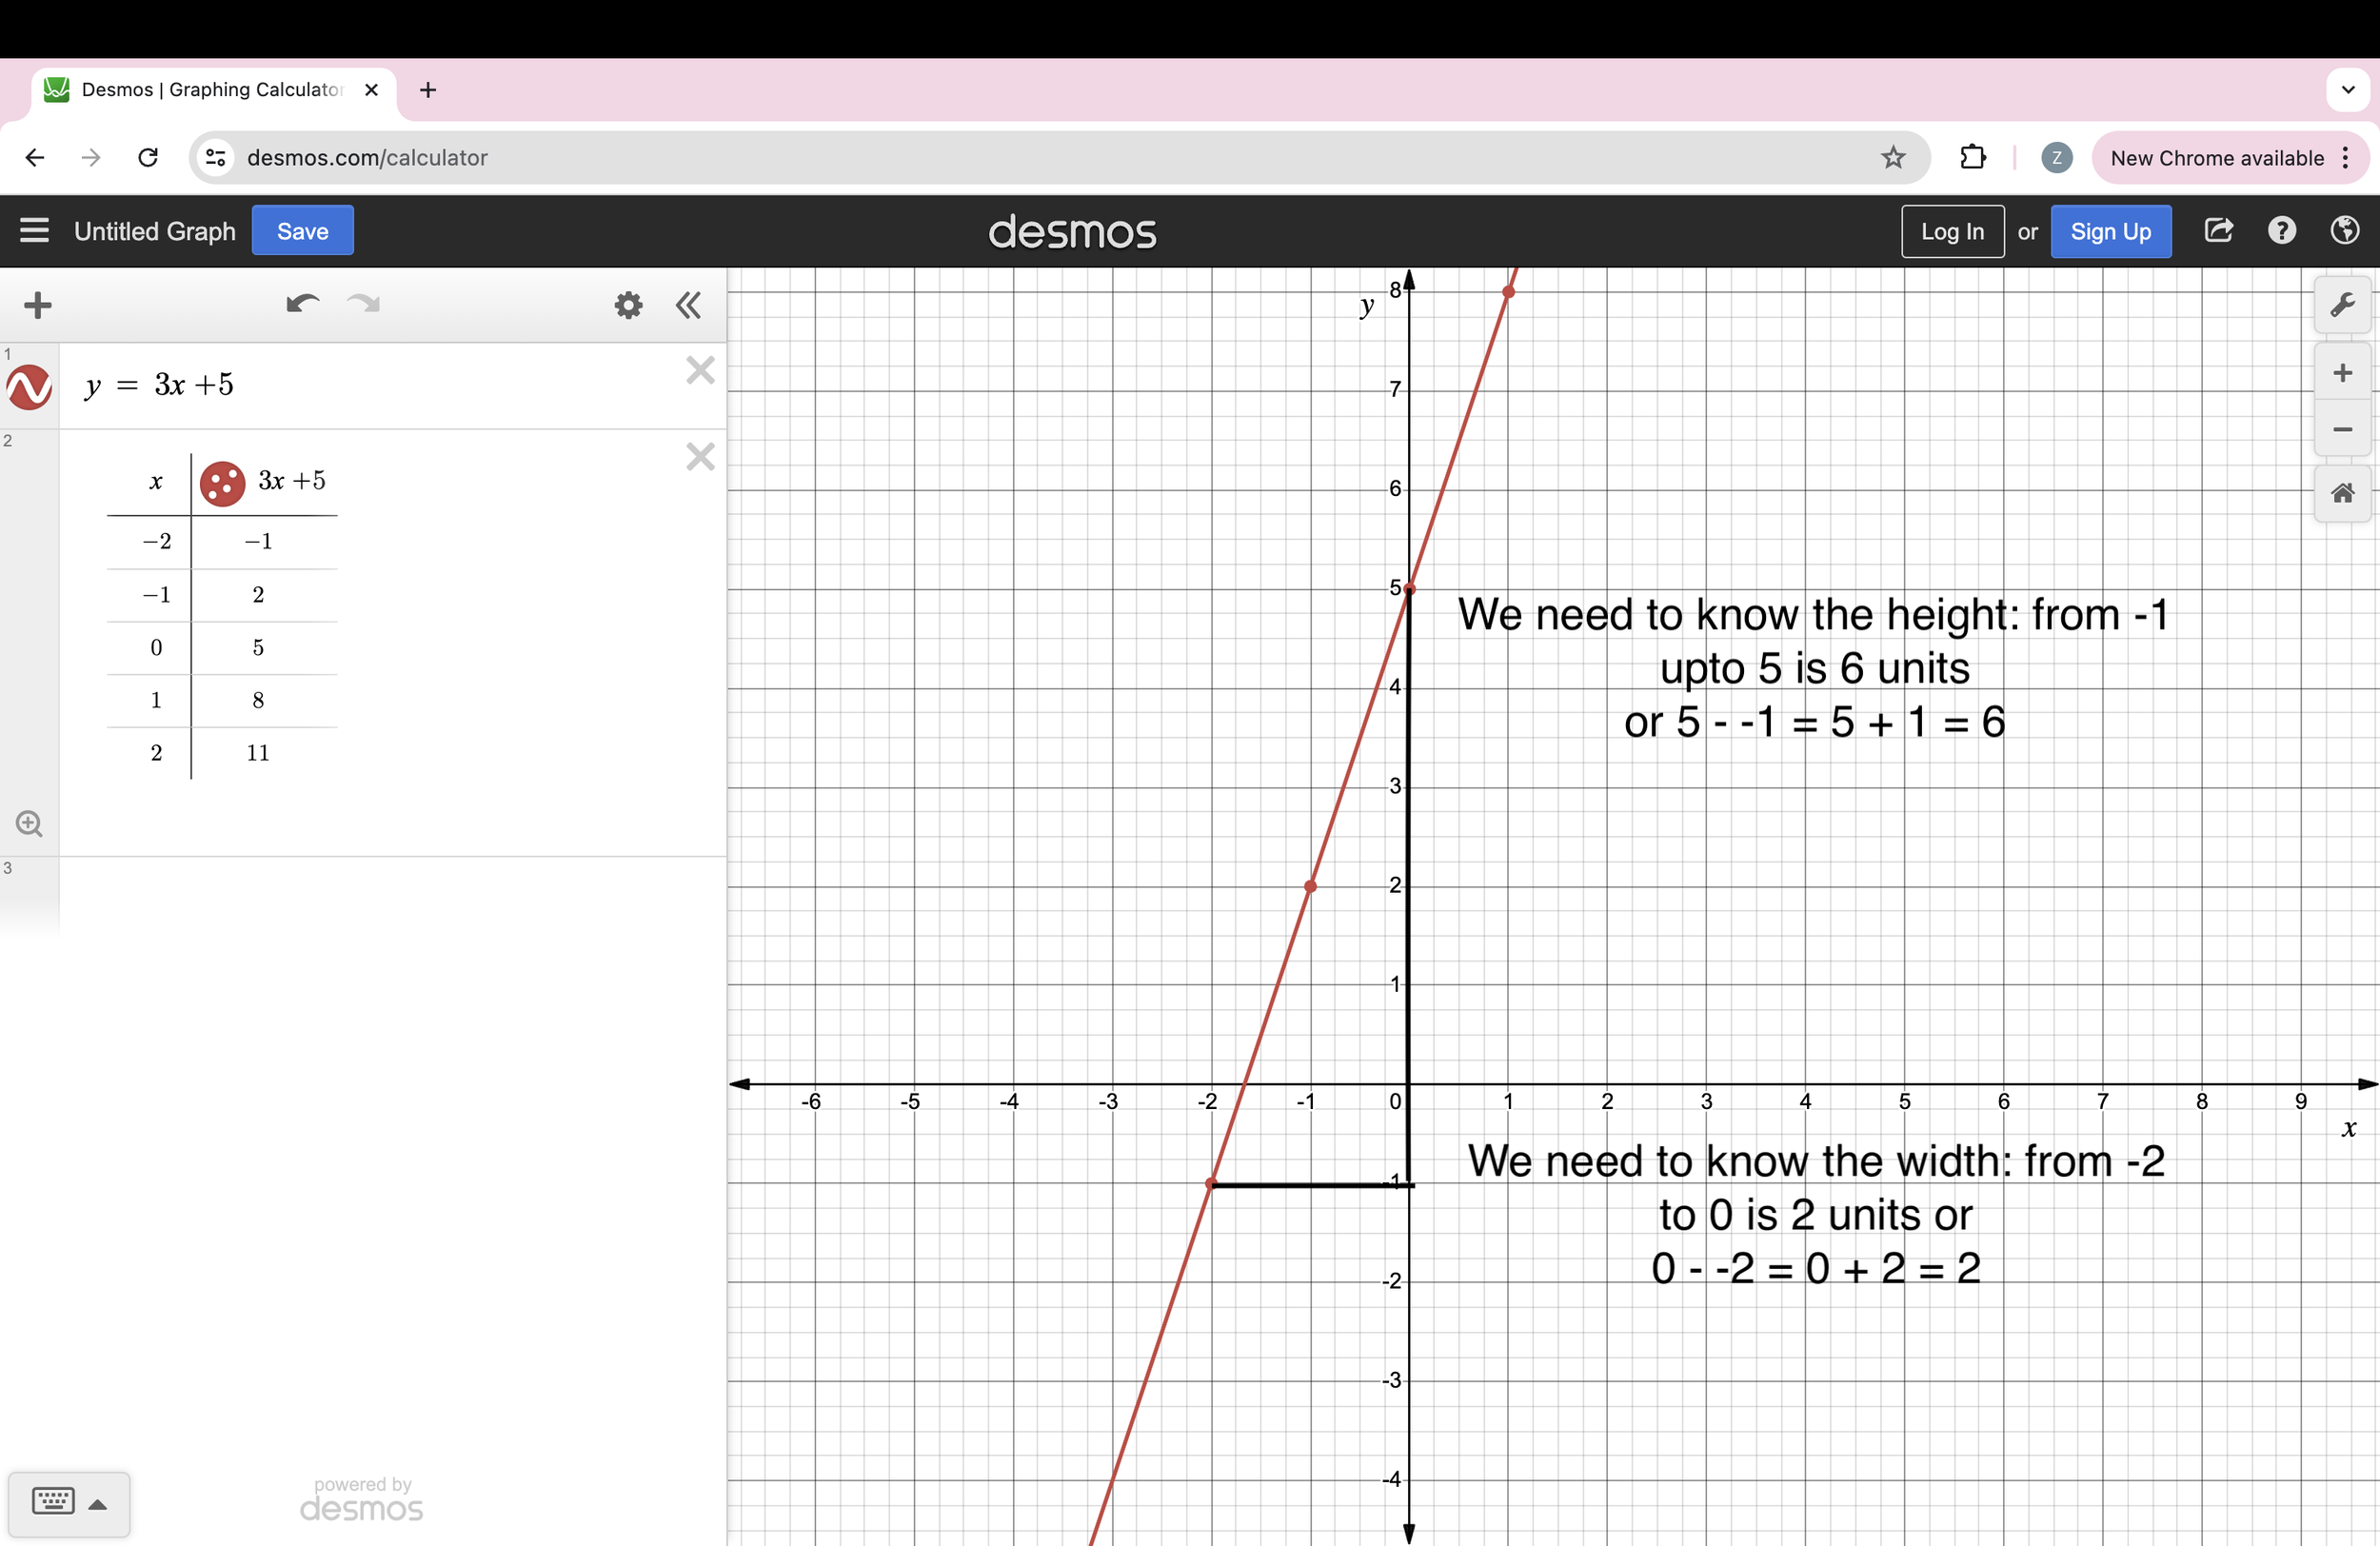
Working out height and width of the line so we can calculate gradient
Gradient is height/width. So for this line: 6/2 = 3
We know this is correct because the equation of the line is y = 3x + 5
You won’t always be given a picture and the equation of the line.
Usually you will be given two coordinates that are on the line and will be expected to know how to calculate the gradient and the equation of the line.
So to work out height and width without a picture do this: y2 - y1 / x2 - x1
In other words do one of the y values subtract the other y value and then do the same for the x values.
Make sure you subtract them the same way, otherwise your answer will be wrong.
So for this example we did (0, 5) and (-2, -1) for the y values we did 5 subtract -1. So for the x values you have to do 0 subtract -2, not -2 - 0.
You pick one set of coordinates to be y2 and x2 and then the other set is y1 and x1. Hope that makes sense!
How to calculate the equation of a straight line:
Wow, we have covered a lot of info so far. This is the last section.
Here’s a quick review:
Graphs represent the link between 2 things.
For this topic we are interested in how x and y are linked.
That’s why our graphs have equations in the form y = mx + c.
M is the gradient of the line, how steep it is and is calculated by dividing the height by the width or y2 - y1/x2 - x1
Once you have found the gradient, you can calculate the rest of the equation.
So far we know that the gradient of our line is 3. So we know the equation is y = 3x + c.
How can we find C?
If you have a graph like the one above, you can see that it crosses the y axis at (0, 5) That means that c is 5, because c is the y intercept.
However, if you don’t have a graph, you can work it out using algebra.
Use one of the coordinates that are on the line. (0 , 5) so x is 0 and y is 5.
Then put them into the equation that you have
y = 3x +c becomes 5 = 3(0) + c
3 multiplied by 0 is 0, so this leaves
5 = c.
So now we can write the full equation as y = 3x + 5
That’s it!! Now you know what straight line graphs are and how to find their gradients and equations.
Here are some practice questions. If you are still stuck you can book a maths lesson here.
Find the Equation of a Straight Line
1. Find the equation of the straight line that passes through the points (2, 3) and (4, 7).